

Abstract
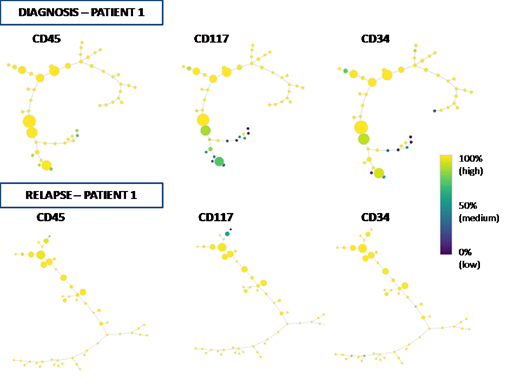
Background.Acute myeloid leukemia (AML) is a heterogeneous disease with respect to cell phenotypes and clinical outcomes.Recently, detailed genetic studies have highlighted the mutational spectrum of clonal variability and increased our knowledge of biologic features of this disease. Nonetheless, characterization of AML cell heterogeneity by traditional Flow Cytometry (FC) is still ineffective because the hierarchical two-dimensional gating analysis of FC data is unable to distinguish all different sub-populations, as defined by the combination of multiple cell parameters. Here, we applied the SPADE algorithm (Ref. Qiu P., Nat Biotechnol, 2011), a new computational approach for dimensional reduction of FC data, in order to represent the intratumoral heterogeneity of AML at single-cell resolution in leukemias at the diagnosis vs. relapsed/refractory AMLs. The purpose of our study was to investigate the clonal dissimilarities of cell subsets as identified by SPADE analysis between diagnosis and relapse/refractory disease status in AML and to define the cell markers mainly associated to the clonal variation of tumor before and after standard therapies.Methods. 30AML patients were investigated at diagnosis and at relapse/ refractory (R/R) disease status by FC analysis.The SPADE algorithm was applied using Cytosplore software (Ref. Hollt. T, 2016) in order to depict the immunophenotype of clonal structures in AML before and after treatment. Each subpopulation was represented by colored circles (nodes) and described the substantial differences between and within individual leukemia subsets. At least a threshold of 7% of events was used to define significant clusters (node) and up to 50 target nodes were used to define the complexity of cell population. All nodes were hierarchically separated by relatedness into a "minimal spanning tree" in relation to the expression levels of 8 Ab markers used for this experiment in the FC panel. The readouts of spanning-tree progression analysis of normalized events (SPADE) reflected the cell heterogeneity underlying the fluorescence intensity of markers used in the FC analysis and defined the relationships among hierarchical cell subsets of leukemia before and after treatment. T-tests and Pearson's coefficient were used to compare antigenic distribution between diagnosis and R/R status. Results.Based on CD45 gating strategy, leukemic population of AML patients at diagnosis showed a median number of nodes significantly lower than that found at R/R disease status (n=4 vs. n= 6 nodes, p=0.0129)(Figure). These data defined an increase of different subpopulations in the R/R subset. Following antigens resulted mainly espressed on the entire study population: CD117, CD34, CD33, CD13, HLADR. The distribution of these markers were further investigated in order to define which cell parameters were able to discriminate the different subpopulations by CD45 expression. Indeed, a comparison of the number of nodes with highest antigenic expression (>90% of intensity value) between AML samples at diagnosis and R/R status was showed. CD117 and CD34 distribution showed a significant difference (p=0.0041 vs p=0.0139, respectively)(Figure) while no statistically significant values were observed among the others. However, only CD34+ nodes showed a significant linear growth between diagnosis and R/R status (p=0.0227).Conclusions. SPADE analysis allowed us to find an increase of subpopulations in R/R AML when compared to samples at diagnosis. CD34 and CD117 antigens mainly characterized these subpopulations, thus defining the cell markers mainly associated to the clonal variation. CD34 antigen was the widest distributed antigen among the new subpopulations, denoting a great instability of more immature clones.
No relevant conflicts of interest to declare.

This feature is available to Subscribers Only
Sign In or Create an Account Close Modal